swarmscale: 8 Million Drones on an HPC Environment
This summer TÜBİTAK ULAKBİM ran a national HPC training program on ARF, TRUBA's new accelerated-computing cluster (named, fittingly, after the mathematician Cahit Arf). Alongside the coursework, participants got something rare: about ten days of access to nodes with four NVIDIA H200s each, NVLink inside the node, InfiniBand between nodes. I had read spec sheets about this class of hardware. I had never typed sbatch at it.
I didn't want to spend the window running someone else's benchmark. My senior project is about parallelized drone-swarm coordination, and it left me with a question I kept running into in the literature: is guaranteed per-agent collision avoidance actually unaffordable at scale? Everyone seems to assume it is. Drone light shows fly pre-deconflicted scripts rather than avoiding collisions online, and the largest published GPU result for ORCA (the standard reciprocal collision-avoidance algorithm) was 500,000 agents at ~33 ms per step.
So before the access window opened, I built swarmscale: a from-scratch CUDA C++17 + MPI mini-application for measuring that assumption on modern hardware. Ten days, four questions:
- How many agents can one GPU fly under a real-time deadline, measured at the 99th percentile rather than the mean?
- How does the same simulation scale across 8 GPUs on 2 nodes?
- Where does inter-GPU communication overtake computation — "the wall"?
- Can the controller be distilled into a neural network by imitation learning, and does it stay safe in closed loop?
The fourth question is where things got interesting, because the answer is no, and the ways it is no turned out to be worth more than a yes would have been.
The controller, and a design decision I'd defend anywhere
Each agent runs a hybrid APF+ORCA controller. Potential fields decide where the agent wants to go; ORCA's linear program clamps that wish against every nearby agent's motion. If those names are new, here's the whole per-agent decision in one picture:
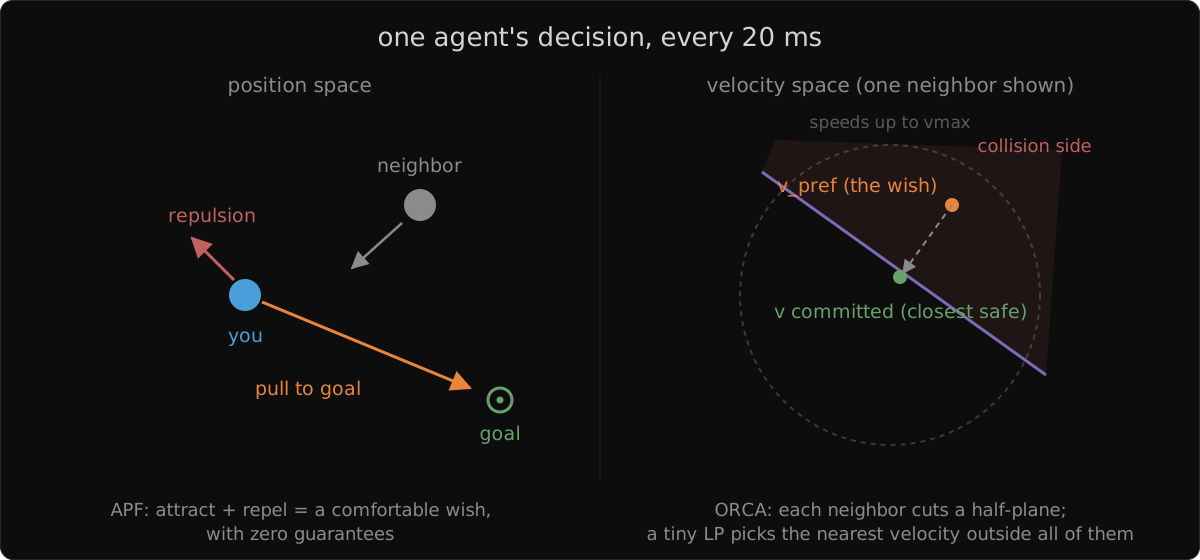
The APF half is inherited from my senior project, which doubles as swarmscale's parity oracle. ORCA I implemented fresh from the RVO2 formulation: a 16-neighbor Seidel LP solved per agent, per step, in registers. In early measurements the hybrid cut danger events by roughly 250× compared to potential fields alone, which is what earns the LP its place in the loop.
Before writing a line of MPI, I committed to a validation rule that shaped everything after it: swarm dynamics are chaotic, so comparing trajectories is worthless. I measured this rather than assuming it. Perturb one agent's position by 10⁻⁵ meters and the simulation diverges 2.45 meters within 500 steps. You cannot eyeball two runs and call them "close". So every gate in the project is either teacher-forced per-step or bitwise.
Bitwise sounds impossible for a parallel simulation, and normally it is, because the order you iterate neighbors in depends on memory layout, message arrival, rank count. The workaround: make neighbor iteration order a pure function of the agent set. Agents are sorted by a 64-bit key, cell index in the high bits, global agent id in the low bits, so within a cell the iteration is always ascending id no matter which GPU owns the agent or how the data arrived. That one sort key is what later made "the distributed run equals the single-GPU run, bit for bit" an achievable test.
Floating point had one more trap waiting. GPU ORCA only matches the CPU bit-for-bit if you compile with --fmad=false. The LP's infeasibility fallback is discontinuous, and one ULP of fused-multiply-add contraction turns into a ~4 centimeter trajectory difference. Finding that flag took a full day, most of it spent suspecting my own code.
One GPU: the assumption is already dead
| Agents | p50 / step | p99 | verdict |
|---|---|---|---|
| 100k | 0.43 ms | 0.51 ms | ≫ 100 Hz |
| 500k | 0.97 ms | 1.17 ms | over 100 Hz |
| 2M | 3.03 ms | 3.37 ms | over 100 Hz |
| 8M | 12.53 ms | 13.14 ms | over 50 Hz |
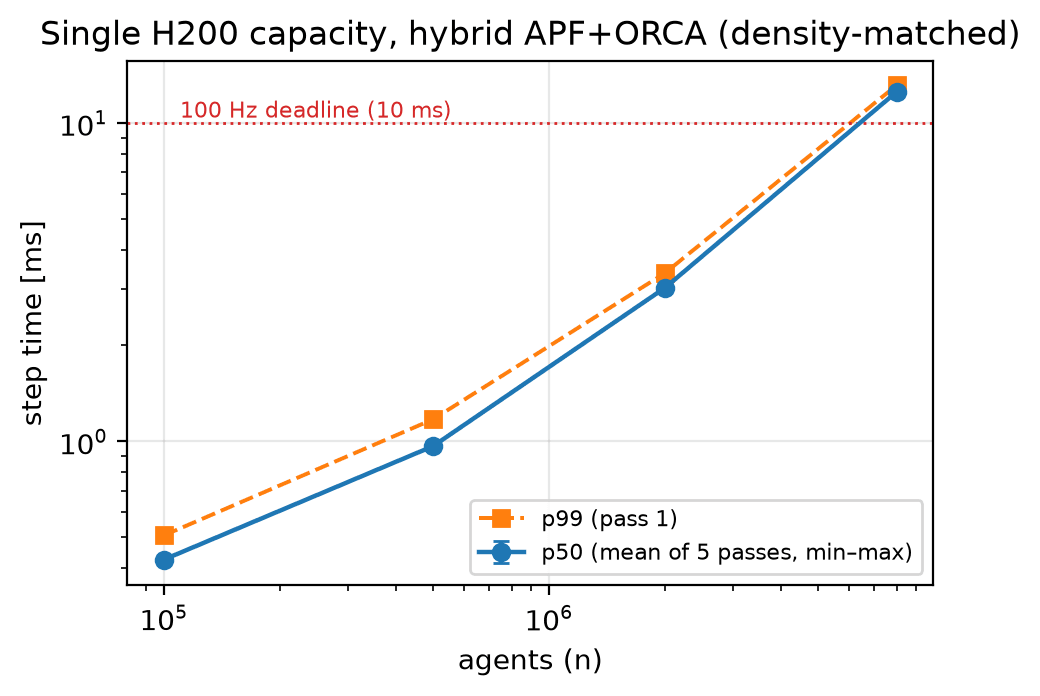
One H200 flies two million agents with guaranteed avoidance at 100 Hz, at the 99th percentile. Every drone show ever flown fits in the 100k row with two orders of magnitude of headroom. The old record regime, 500k agents at ~33 ms, happens here in under a millisecond — different hardware generation, so compare regimes rather than milliseconds, but the regime moved a long way.
Eight GPUs: scaling, and proving it didn't change the physics
The multi-GPU version splits the world into a static 2-D grid of subdomains. Each step: migrate agents that crossed a boundary, exchange a one-cell ring of "ghost" neighbors, then solve physics on owned agents with ghosts visible read-only:
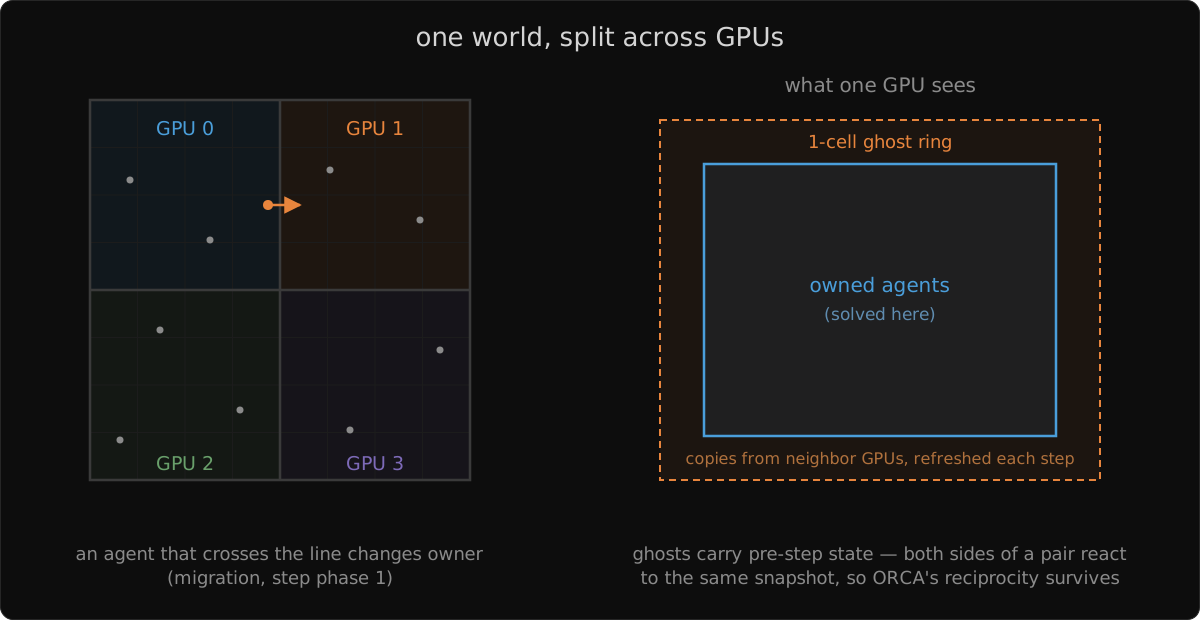
One subtlety I'm glad I caught early: ghosts carry pre-step state, never post-solve outputs. ORCA's math assumes both agents in a pair are reacting to the same snapshot, and sending fresher data would quietly break that.
The gate held. The distributed simulation is bitwise identical to the single-GPU run at 2, 4 and 8 ranks, where 8 ranks means two nodes and the halo exchange crossing InfiniBand. My favorite single number of the whole campaign: an exact-integer safety accumulator reads 1488560980 on one GPU, on 2 ranks, on 4, and on 8. The same integer, four ways.
With correctness pinned, the performance campaign ran as five independent repetition passes per configuration. 80 runs, 80 green.
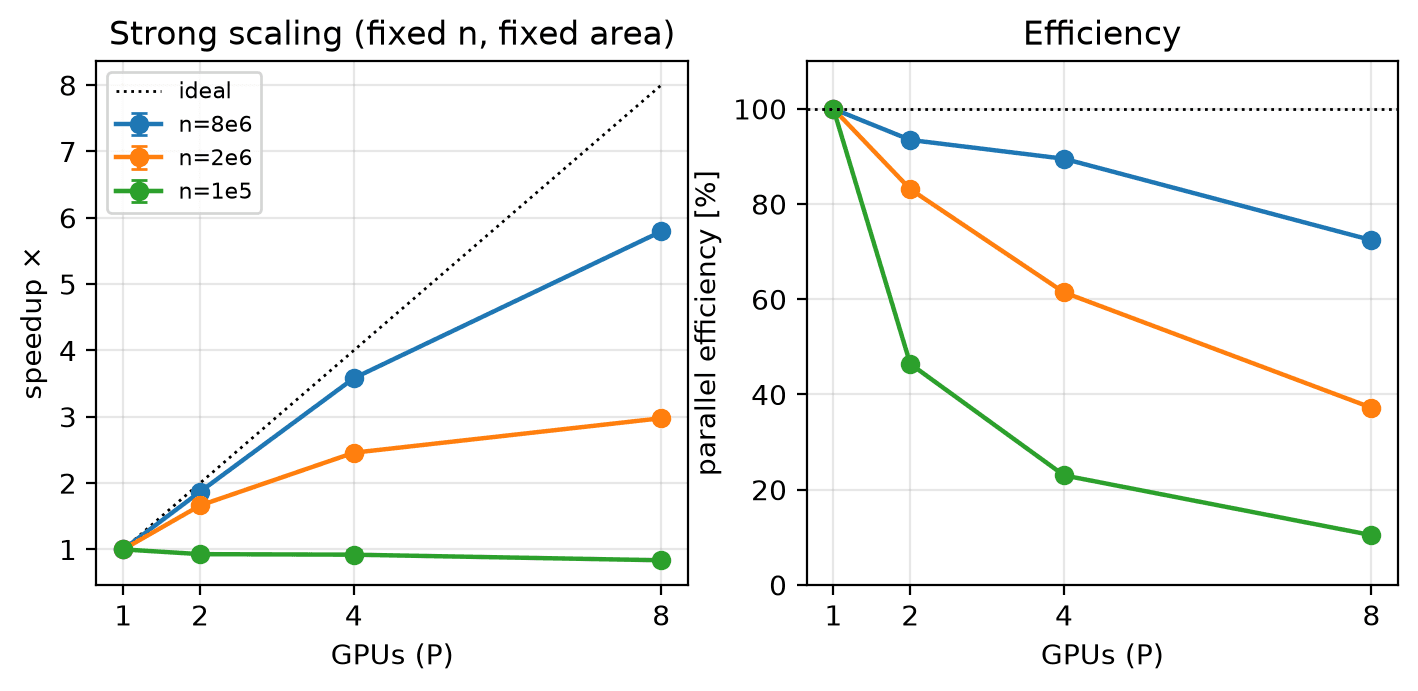
- Strong scaling at 8M agents: 5.82× on 8 GPUs (73% efficiency). 8M agents step in 2.15 ms with a p99 of 2.34 ms, which is under the 100 Hz deadline, at an aggregate ~3.7 billion agent-steps per second.
- At 2M agents, 8 GPUs only buy 2.93×. At 100k, multi-GPU loses to one GPU.
- The wall, measured: multi-GPU stops paying somewhere between 50k and 250k agents per GPU. That's roughly an order of magnitude stricter than the ~15k I'd predicted from the literature while planning.
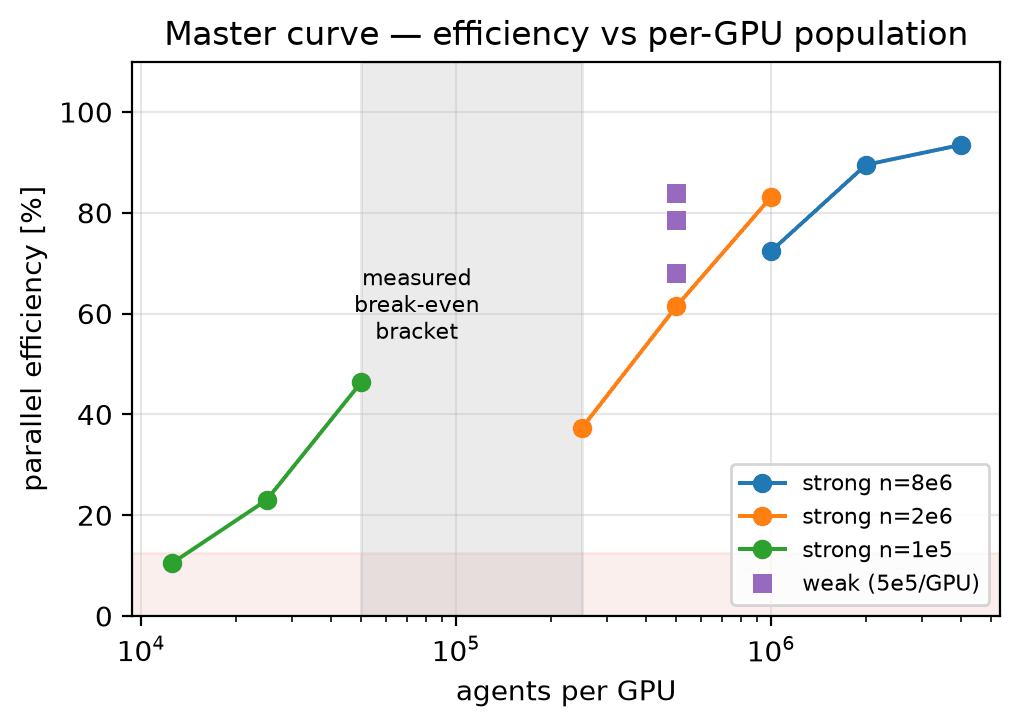
That last point inverts the usual scaling narrative, and it's the practical guidance an operator actually needs: below ~100k agents, the second GPU is the wrong tool.
Three things the cluster taught me that no textbook did
The UCX rendezvous collapse. The single biggest performance fact of the campaign. With default settings, inter-node GPU-to-GPU transfers serialize as soon as more than one GPU per node communicates concurrently: step time went 0.70 → 6.0 → 7.7 ms as 1 → 2 → 4 GPUs per node joined the exchange, while the fabric itself measured perfectly healthy. Pinning one environment variable (UCX_RNDV_THRESH=1m) removed the collapse, a 12.5× improvement, but costs ~10% intra-node, so it's applied only to multi-node jobs. I tried seven other UCX variables first; each got measured and rejected. The root cause is still open. At these message sizes, your interconnect's protocol selection can dominate everything you did in CUDA.
Idle GPUs lie to benchmarks. Early fabric measurements showed latencies 20× worse than spec, on some runs, randomly. I lost most of an evening to this before finding the cause, which was not the network: an idle H200 clocks down to 345 MHz (max 1980), and a device-buffer microbenchmark launched onto cold cards measures the clock state, not the fabric. The control that settled it ran on the same GPU pair in the same job — 81 µs when measured first thing, 4.58 µs after a warm-up workload, while host-to-host latency on the identical NIC path stayed flat throughout. The smoke script now refuses to record a verdict from suspect readings.
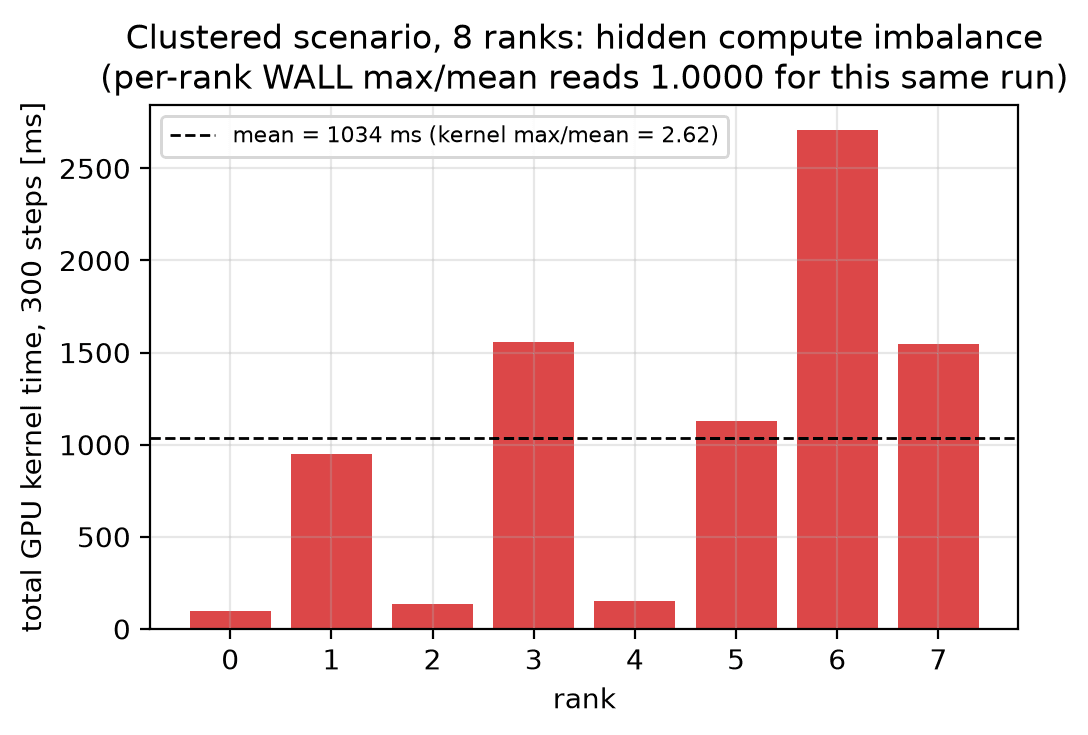
Wall-clock statistics are structurally blind to load imbalance. A clustered scenario runs 10.6× slower than uniform at the same size, yet per-rank wall-time imbalance reads a perfect 1.0000. The per-step exchange is a rendezvous, so every rank's clock includes waiting for the slowest. Per-rank kernel time from profiler traces tells the truth: a 27× spread, one hot GPU pacing seven idle ones.
There was also a proper null result. A communication/computation overlap schedule — halo exchange on a second CUDA stream while interior agents are solved concurrently — ships in the code and is verified bitwise. It doesn't help. It hides ~262 µs/step of MPI stall and pays ~262 µs/step back in doubled grid builds and split kernel launches; the p50 delta is ±0.1% against a 4% noise floor, and the tails get consistently worse. It stayed off for every published number. I'd rather know why it's a wash, with per-stream traces, than have shipped it hopefully.
A smaller lesson, for anyone who ends up on a SLURM cluster with a CMake+CUDA project: editing a shared header does not reliably rebuild the CUDA objects that include it. A stale device object linked against fresh host code doesn't fail the build — it fails the CPU-vs-GPU parity test, which sends you hunting for a numerical bug that doesn't exist. That one cost a full diagnosis cycle before I understood it and made the build script touch the CUDA files every time.
Act two: distilling the controller into a neural network
The scaling results raise a question they can't answer. The hybrid controller is affordable on a datacenter GPU, but its core is an iterative linear program with a data-dependent trip count, which is about the worst shape for an embedded flight controller. Could a fixed-shape neural network learn the controller by supervised imitation, and stay safe?
Collecting the dataset honestly took some machinery. A pair logger re-runs the entire teacher controller for a sampled subset of agents and asserts the recomputed velocity is bitwise equal to the one the simulation committed, then records the pair: a 69-float egocentric observation in, the post-LP velocity out. If the logger and the sim ever disagree by one bit, the run dies. The result was 7,284,900 teacher decisions across 243 simulation files, split by whole file (never by row) across two scenario families, three densities and two obstacle layouts.
The winning architecture is a permutation-invariant DeepSets encoder over neighbor slots. A plain MLP over the flattened observation loses to it at every width I tried. The shipped width-128 model has 27,970 parameters; the width-16 runner-up, 5,794. Training is deterministic end to end, one seed giving one byte-identical weight blob, and the CUDA inference kernel is gated bitwise against a C++ reference, which is gated against PyTorch's forward pass.
Offline, the student looks finished. Held-out median action error: 0.00472 m/s, which is 0.047% of the command range. Every offline statistic says the controller has been learned.
Then you close the loop and let the network fly the swarm itself:
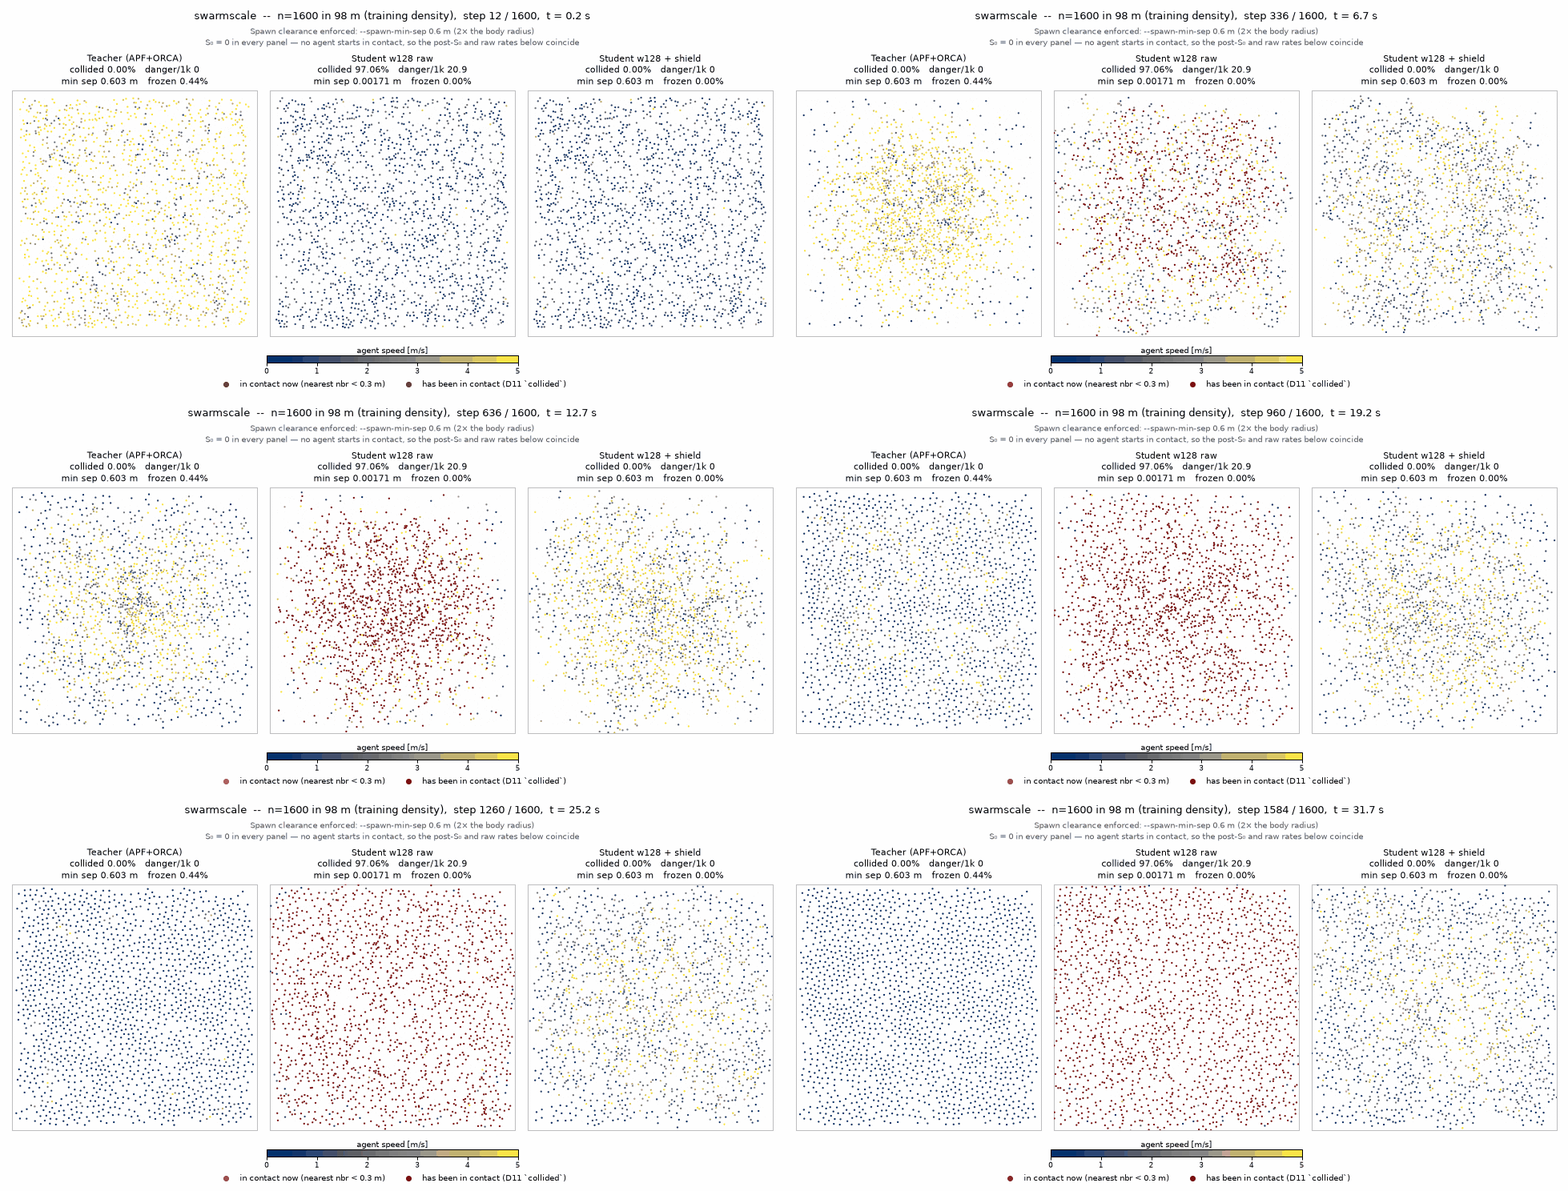
Left: the teacher, 0.00% collided. Middle: the same network that just scored 0.047% offline error, flying alone. 94.7% of agents collide. Right: the fix, which the next section covers.
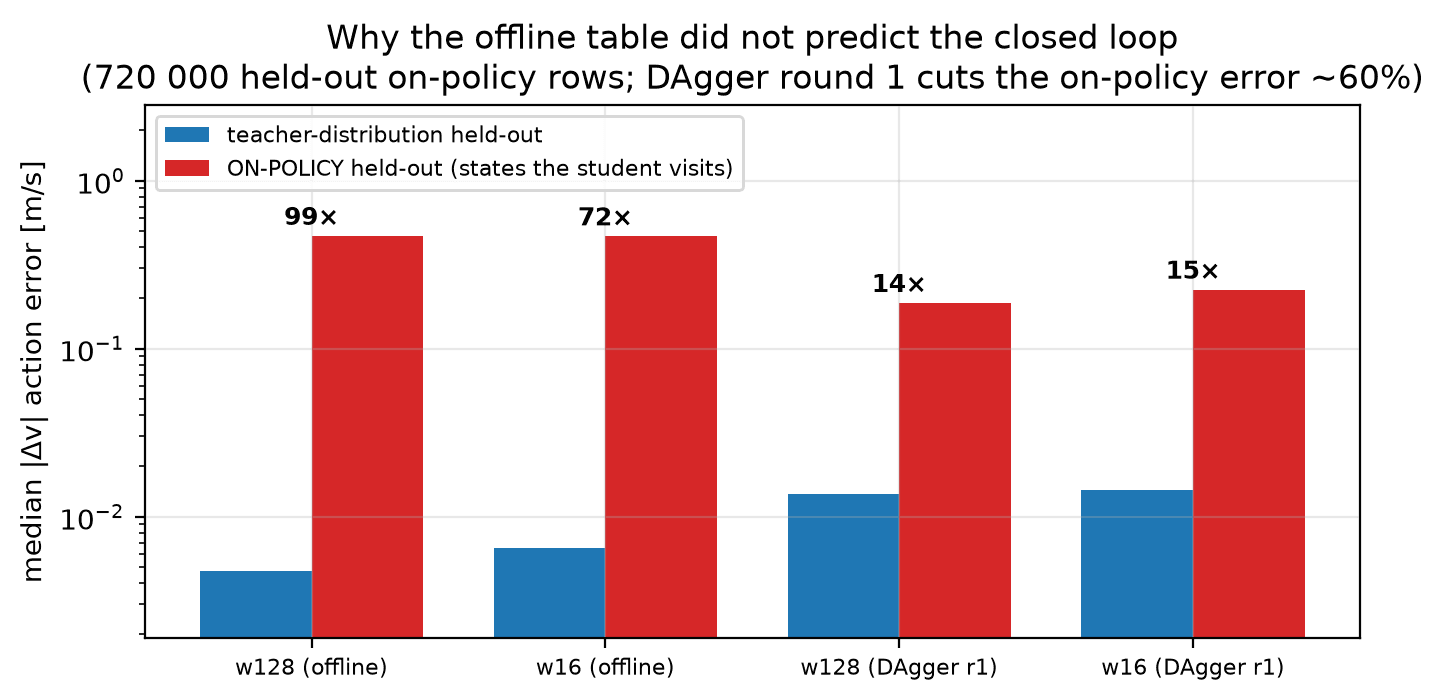
This is the covariate-shift lesson every imitation-learning paper warns about, and I got to measure it instead of reading about it. Scored on states the student itself visits, the same model's action error is 99× worse than on the teacher's states. No amount of held-out MSE on the teacher's distribution would have exposed this; the offline table simply cannot see it. A later audit sharpened the number: about 21× of the gap is the deployment distribution itself, and ~5× is the student's own drift.
The shield: safety by construction, and what it honestly costs
The deployable configuration doesn't let the network near the safety guarantee. The network replaces only the comfort half of the hybrid: its output becomes the preferred velocity fed into the teacher's own ORCA LP, which still clamps everything. A learned proposer behind a classical certificate:
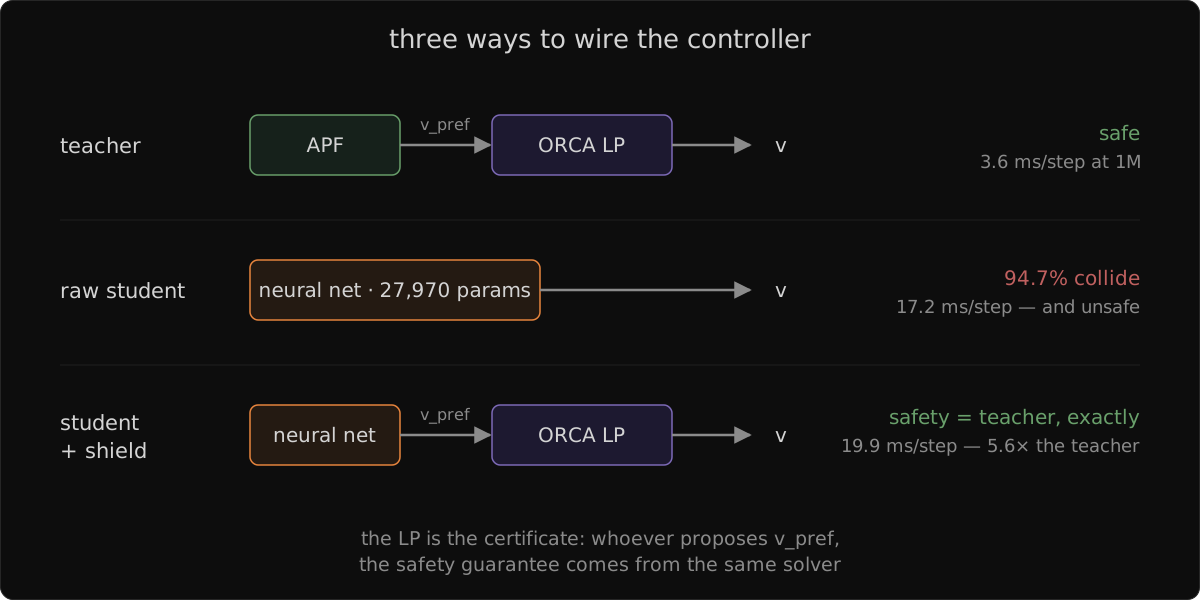
With the shield on, the student matches the teacher's danger rate, collision count and global minimum separation to every printed digit, at every scale measured, including 8 million agents on 8 GPUs. That result was expected — it's the same LP — but "the shield should preserve safety" and "the shield preserved safety in this table" are different sentences, and now I have the second one.
Then the cost table arrives:
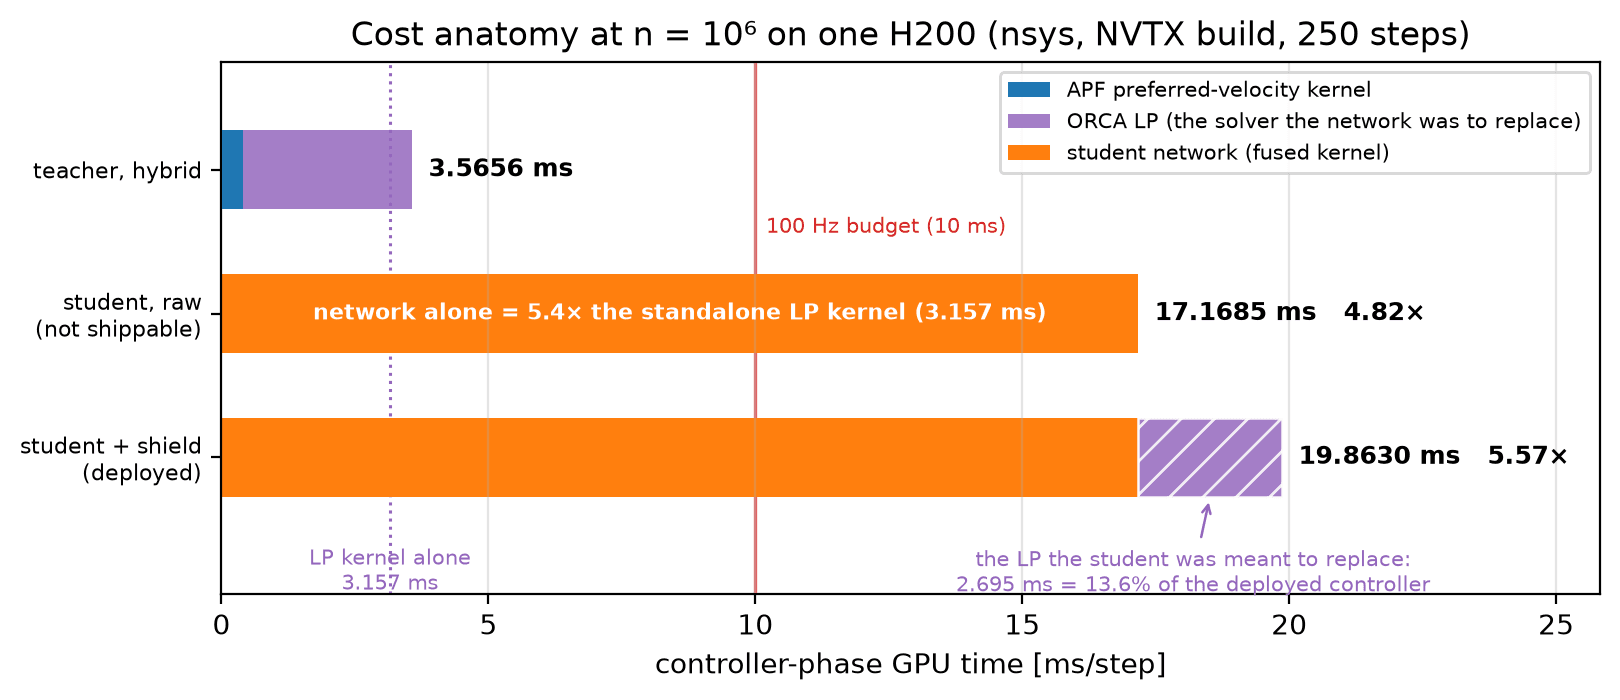
The 27,970-parameter network costs 5.4× more than the linear program it was distilled to replace. The deployed shielded configuration is 5.6× the teacher's cost, and the LP — the part with the actual guarantee — is only 13.6% of the deployed controller's time. The distillation's entire economic motivation ran backwards. My best guess at the mechanism is the student kernel's ~6 KB per-thread working set spilling to local memory, but the profiler counters that would confirm it are administratively locked on the cluster, so it stays a hypothesis in the report rather than a finding.
DAgger, an audit, and the weirdest positive result
One round of DAgger — collect states under the student's flying, label them with the teacher, retrain — roughly halved the on-policy error and multiplied goal completion several-fold at unchanged safety. Same seed, same scene:
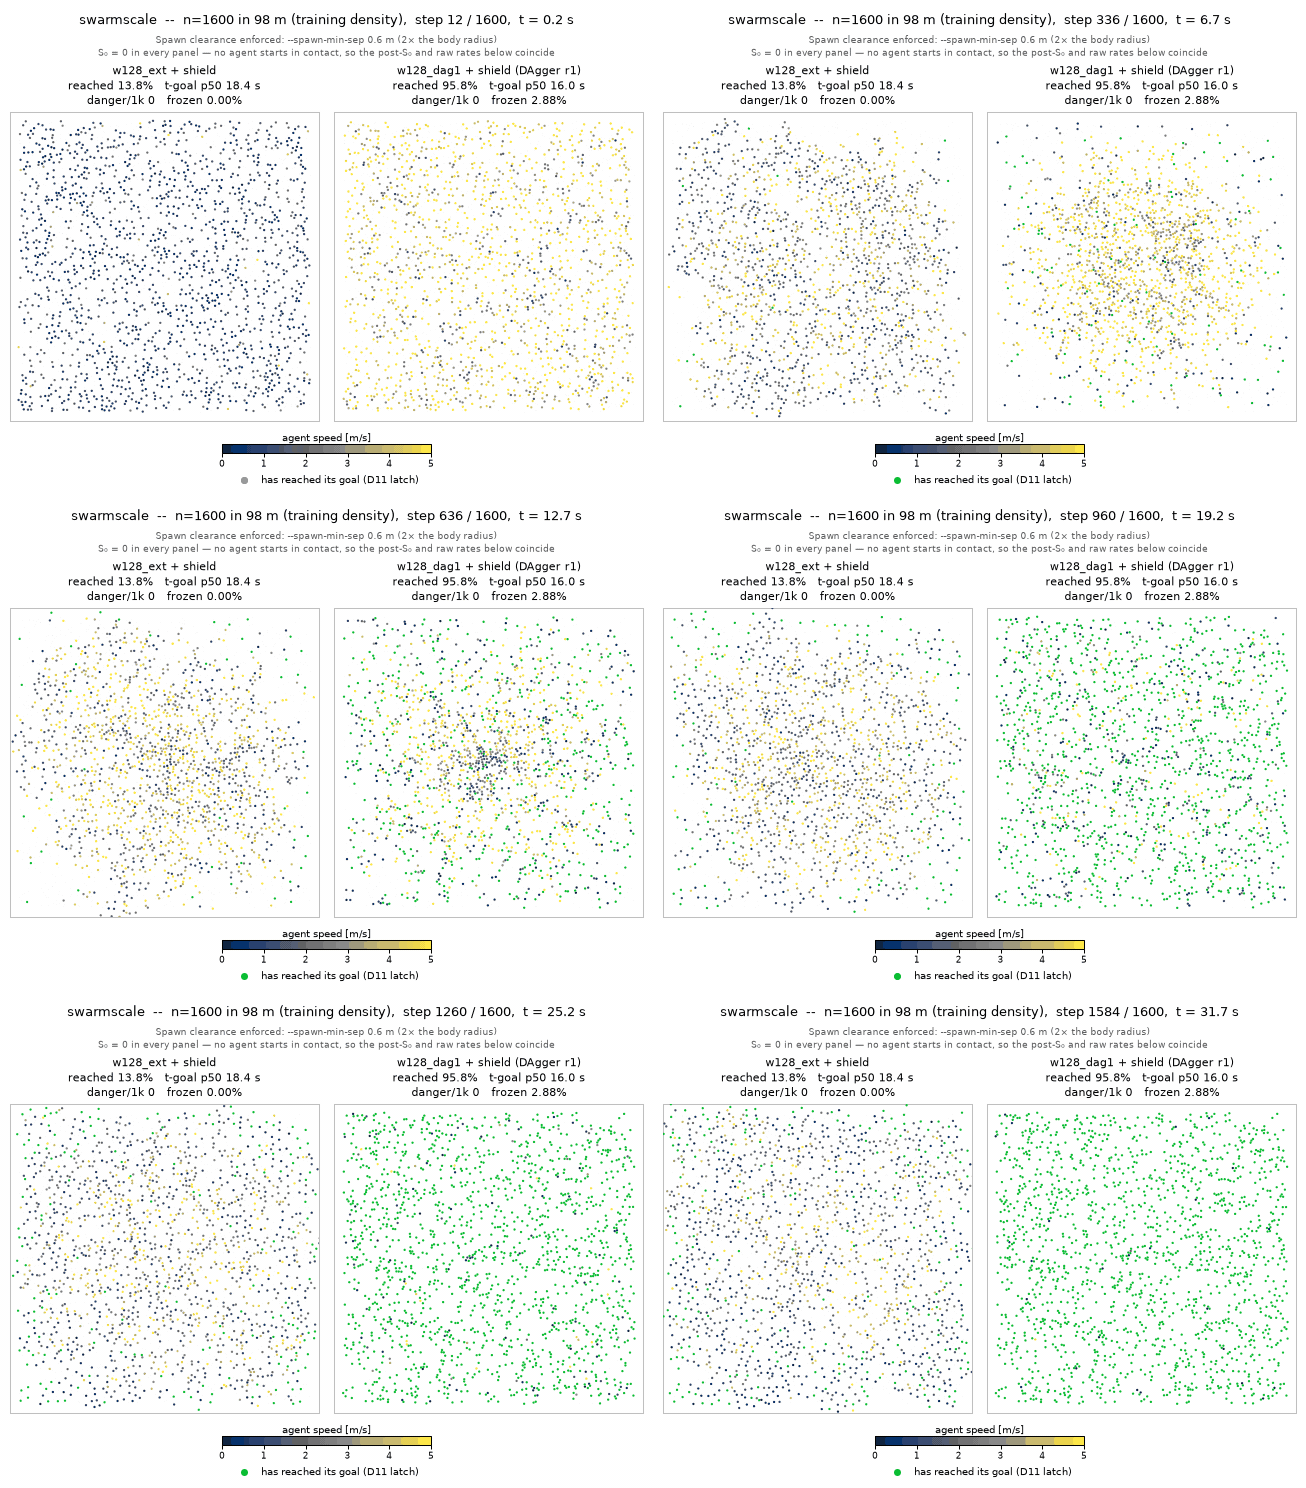
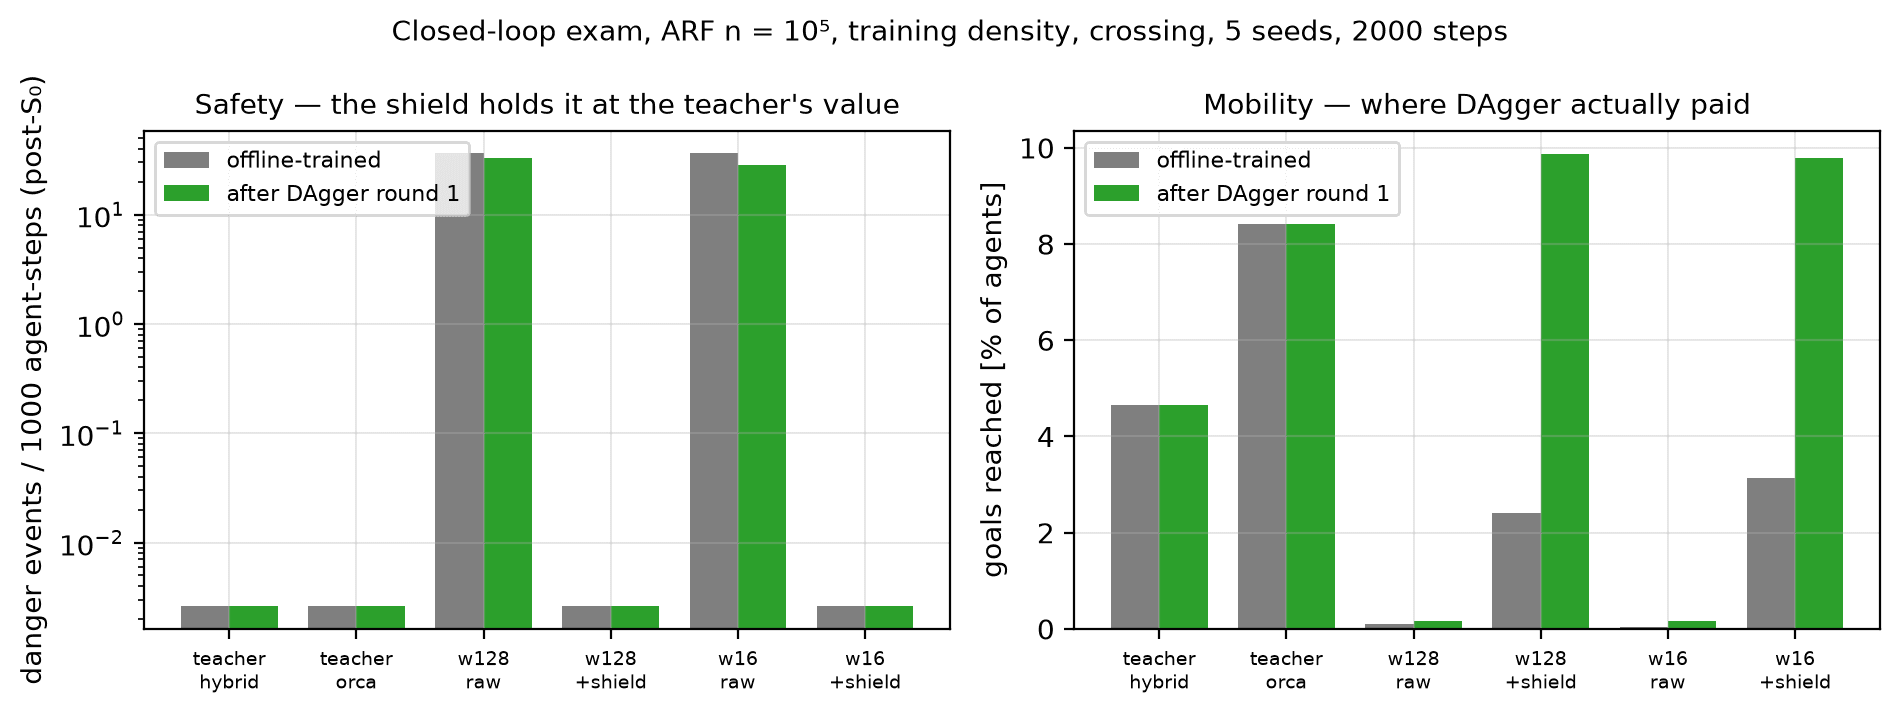
Two caveats belong next to that GIF. First, an audit pass over the artifacts caught that the DAgger round's labels had been collected with the wrong teacher variant — ORCA-only instead of hybrid. A controlled replay put the like-for-like mobility gain nearer 2×; the rest of the published margin was the more aggressive teacher leaking through the labels. Every affected number was re-derived and corrected in the report. The reason the audit could correct results rather than just cast doubt on them is that a verification script re-derives all 271 quoted figures from their committed artifacts and fails loudly on any drift. Second, the DAgger students drive so hard they overflow their own 128-candidate observation format in the held-out corridor scenario and refuse to run it, so they ship as a documented mobility variant rather than the default.
And yet the strangest result of the project survives every correction. At a fair horizon at one million agents, the shielded DAgger student completes more goals than the teacher it was distilled from — 12.0% versus the hybrid teacher's 8.0% — at safety identical to every printed digit, and it reaches those goals sooner (median arrival 4,397 steps versus 4,699, which rules out the "it only finishes the easy goals" artifact):
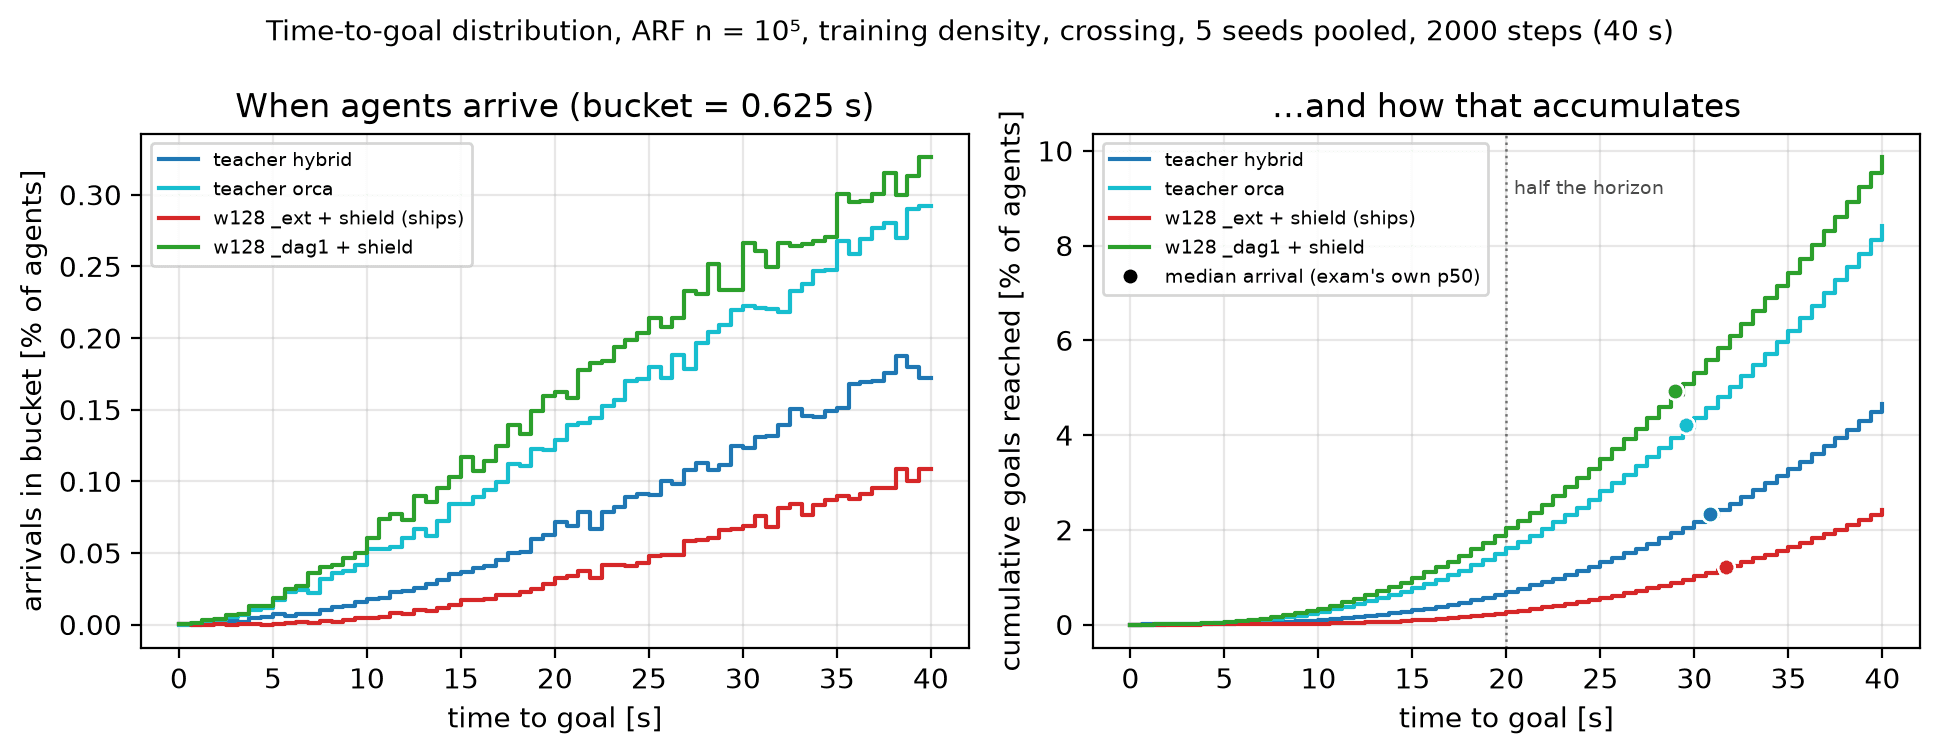
A network distilled from the teacher, projected through the teacher's own solver, out-throughputs the teacher. The LP spends the network's aggression on feasibility.
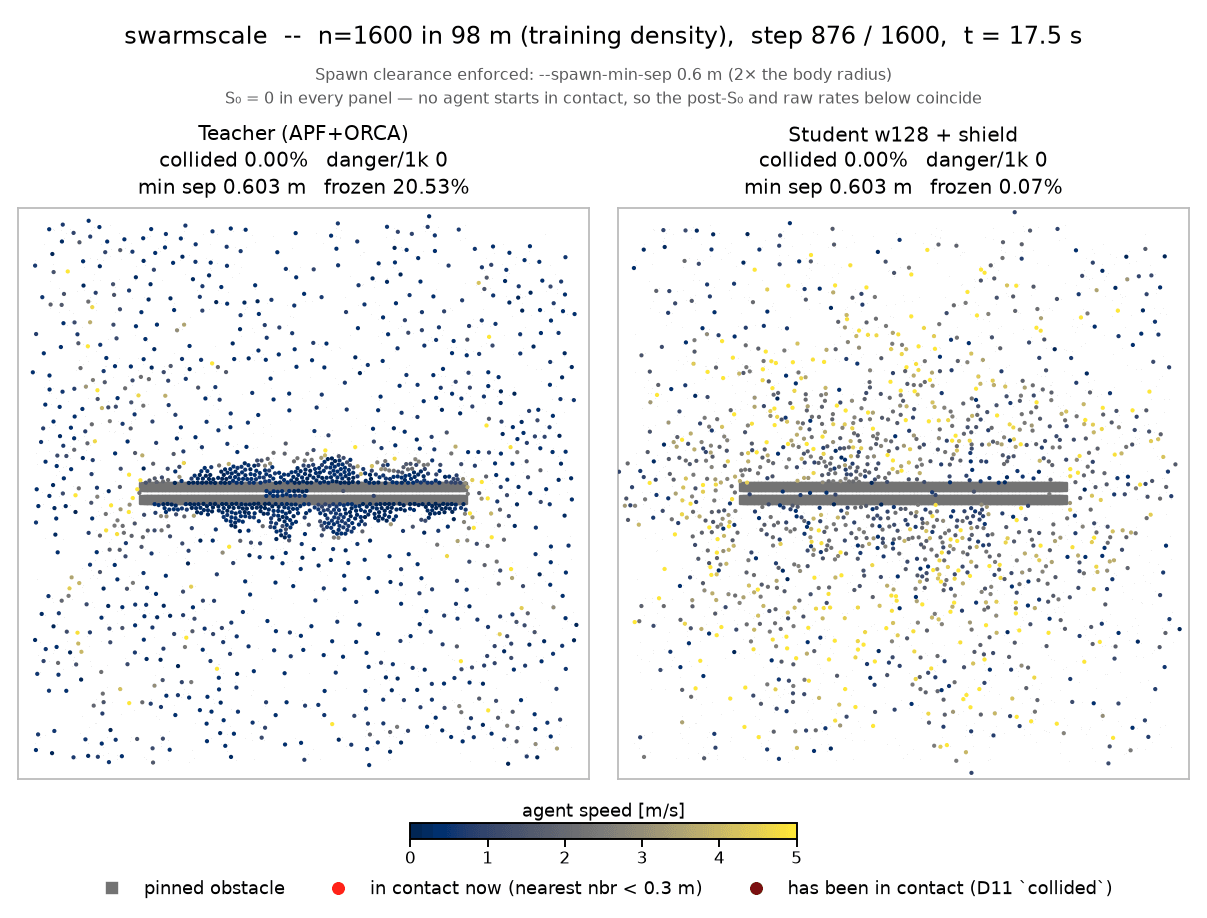
The corridor scenario shows the same trade from the other side. The teacher jams at the gap and freezes 20.5% of its swarm; the conservative shielded student freezes 0.07% and flows through:
Taking it off the cluster
A cost ratio measured on one GPU is a fact about that GPU, so two follow-up measurements happened after the access window.
First, a consumer RTX 5080. The ratio doesn't transfer: the raw student's 4.4× penalty compresses to 3.3×, because the teacher turns out to be the bandwidth-bound arm — the H200's HBM was subsidizing the LP's neighbor gathers, not the network. The part that makes the comparison legitimate: H200 (sm_90, CUDA 12.4) and RTX 5080 (sm_120, CUDA 13.3) produced bit-identical trajectories, 27 field comparisons with zero differences, including a 43-bit exact integer accumulator over 250 million agent-steps. The same determinism that pinned the MPI decomposition holds across GPU architecture generations, which I did not expect to be able to say.
Second, a phone, because the embedded argument was the whole point. On one Cortex-X4 core (verified to hold 3.01 GHz), the teacher's entire per-agent decision — APF plus the 16-half-plane ORCA LP — costs 0.253 µs, about 763 cycles. One phone core flies 78,934 agents at 50 Hz, and a real drone needs one. The student, through its best mobile runtime, is 11.3× slower. A tiny network still pays a generic inference runtime's overhead around 12k MACs, while the LP is just branchy scalar code that any CPU eats natively. A bonus lesson from that day: the NPU delegate claimed to run and returned plausible latencies, but the per-node execution profile showed everything silently falling back to CPU. Never trust a delegate that doesn't show you its placement.
So across every platform this project measured — datacenter GPU, consumer GPU, mobile CPU — the classical controller is the cheaper one. The report says so in bold, because a version of this study that buried that sentence would be worse than no study.
What this project is actually a result about
The regime was deliberately the classical method's best case: perfect state for free, no dynamics to invert, a controller that reduces to ~750 cycles of arithmetic. Under those conditions, distillation turned out to be a cost regression that incidentally bought throughput. That makes this a boundary-of-applicability result, a negative control for the learned-control literature, which usually assumes exactly this case away.
The conditions that would flip the ranking are named in the report so a follow-on can check them instead of re-deriving them. Real dynamics is the big one: the moment agents have mass and actuator limits, the teacher stops being a one-shot LP and becomes an iterative MPC solve, which is the regime where amortizing it into a network starts to pay. Real perception is the other: my simulator handed the classical stack exact neighbor states for free, a subsidy it does not get in the field, while a learned controller can fold perception into the same forward pass. What didn't flip anywhere: the raw network never became safe on its own — ~94% collided at every width, scale and training recipe. The architecture that survives everywhere is the one this project ended up validating: learned proposer, classical certificate.
One line, if you keep one: learning failed to make the controller cheaper and incidentally made it better; the case for learned control lives where the teacher is expensive or the state is imperfect, and both are outside this regime by construction.
What ten days on a supercomputer actually teaches
Not CUDA, and not MPI. I had those going in. What the window actually taught me was evidence discipline at campaign speed, because on a shared cluster with a closing date you do not get to re-run last Tuesday. Every number in the final report traces to a SLURM job ID and a committed JSON. Batch jobs self-check and print verdict lines instead of relying on me to read logs at midnight. Suspect readings get quarantined instead of harvested. The negative results — the overlap null, the cost regression, the covariate collapse — went into the report at the same weight as the wins.
Some smaller things I now know that I didn't in July: SLURM's MaxArraySize means a 146-row job matrix becomes several chunked arrays with an offset variable; a GPU binding flag can silently put all eight of your ranks on GPU 0 (measured, then worked around in-app); and admin-locked profiler counters mean your favorite tool may simply not exist on someone else's cluster, so the fallback instrumentation you built into the binary is what saves you.
Computing resources were provided by TÜBİTAK ULAKBİM's TRUBA infrastructure through the ARF education program, and I'm genuinely grateful to the team running it. If you're a student in Türkiye and this program runs again: apply. They will hand you hardware you cannot buy, and the queue will teach you things the documentation won't.